Relative Quantification Analysis using Workbench Software.
The Basics of Gene Expression
Using real time PCR (qPCR) for gene expression analysis has been an established method for some time now. The aim of gene expression analysis is to compare the amount of mRNA between a treatment group and control group. This gives better understanding of the normal or disease state of any biological system.
What is qPCR gene expression analysis used for?
When it comes to gene expression analysis qPCR is particularly effective in detecting and precisely quantifying target genes. As such, it’s used for a diverse range of applications. This includes genotyping, biomarker discovery and pathogen detection such as testing for COVID-19. Because this type of analysis can shape clinical care, public health, research, pharmaceutical development and even the quality and safety of the food we eat, it’s clearly important to have efficient qPCR and analysis workflows. Let’s take a closer look at gene expression analysis using Bio Molecular Systems’ own qPCR software.
First steps in qPCR gene expression analysis
The process begins with the extraction and isolation of mRNA from a biological sample such as tissue or liquid biopsy. As the mRNA cannot be used in PCR, it must first be converted to cDNA using reverse transcription (RT). RT-qPCR can be achieved in either a one-step or two step procedure. To account for variations in starting template and RT efficiency, an endogenous housekeeping gene is also amplified. This reference gene is used to normalise for the variations, and as such it must be proven to not vary in expression profile between treatment and control groups. The geNorm method developed by Jo Vandesompole et al. in 2002 is one such method for determining reference gene stability between groups.

Determining Quantification Cycle (Cq)
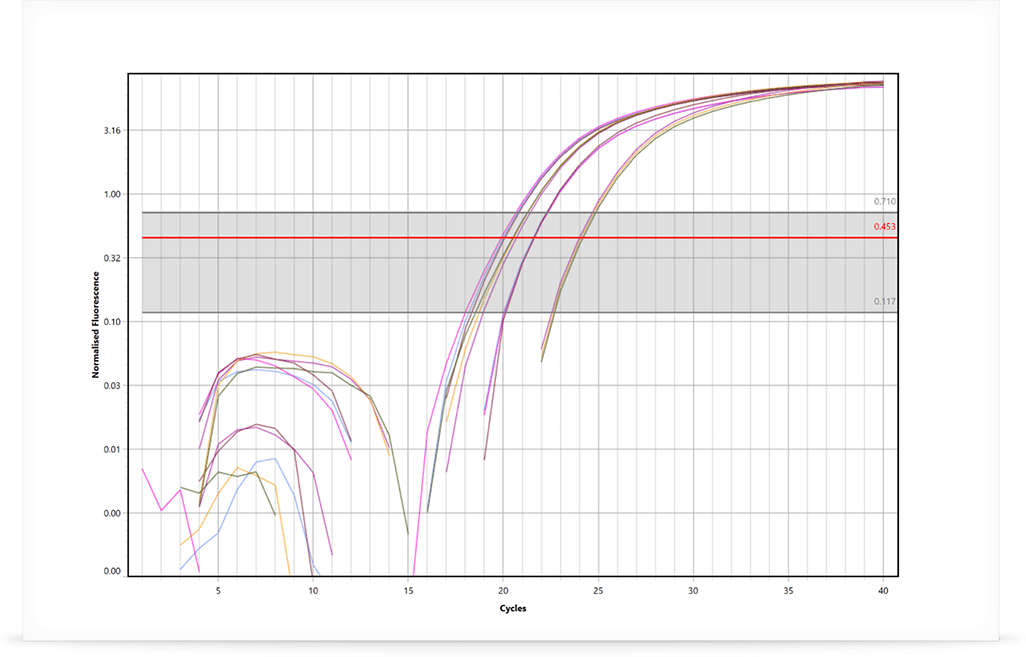
Once the RT-qPCR is completed, the resulting real-time curves are analysed to determine the gene expression ratio between groups. The first step is to determine the DNA and RNA quantification cycle (Cq) for each sample of each investigated gene. One approach is to use the LinRegPCR method developed by Jan Ruijter et al. in 2003 and published again in 2009.
The LinRegPCR algorithm utilises the region of exponential growth to calculate Cq values, while minimising the variation among the dataset: thus avoiding the potential for miscalculations of efficiency and starting target concentrations due to either over or under estimating the baseline subtraction. This is a highly accurate and reproducible method to calculate Cq values, which has the added benefit of reporting an efficiency value for each sample rather than using a standard curve. Using individual efficiencies removes the issue of random pipetting errors during dilution of the standards or the dilution of PCR inhibitors, both issues that can introduce errors in the standard curve (Ramakers et al. 2003; Ruijter et al. 2009). Other baseline correction methods and threshold setting strategies can be employed to determine Cq values as well.
Calculating Gene Expression Ratios (R.E)
The relative gene expression ratio (R.E.) can be calculated once the Cq values are determined for the gene of interest and reference gene. The simplest equation for qPCR data analysis describes the determination of the starting concentration. It uses the amount of target at the quantification cycle (Cq) and efficiency of the reaction.
The equation developed by Michael Paffl in 2001 was the first to ensure each individual reaction efficiency was used. This is crucial because the final result can be biased if the difference in reaction efficiency between targets is not considered.

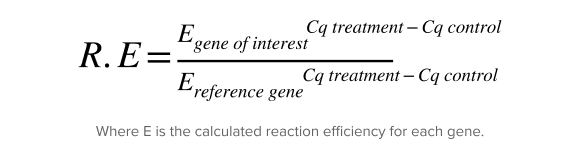
An alternative method – one that is still popular today – is delta-delta Ct (ΔΔCt), published by Livak and Schmittgen in 2001. This method assumes the efficiency is 100%, which is acceptable as long as it has been validated that the gene of interest and reference gene have similar efficiencies.
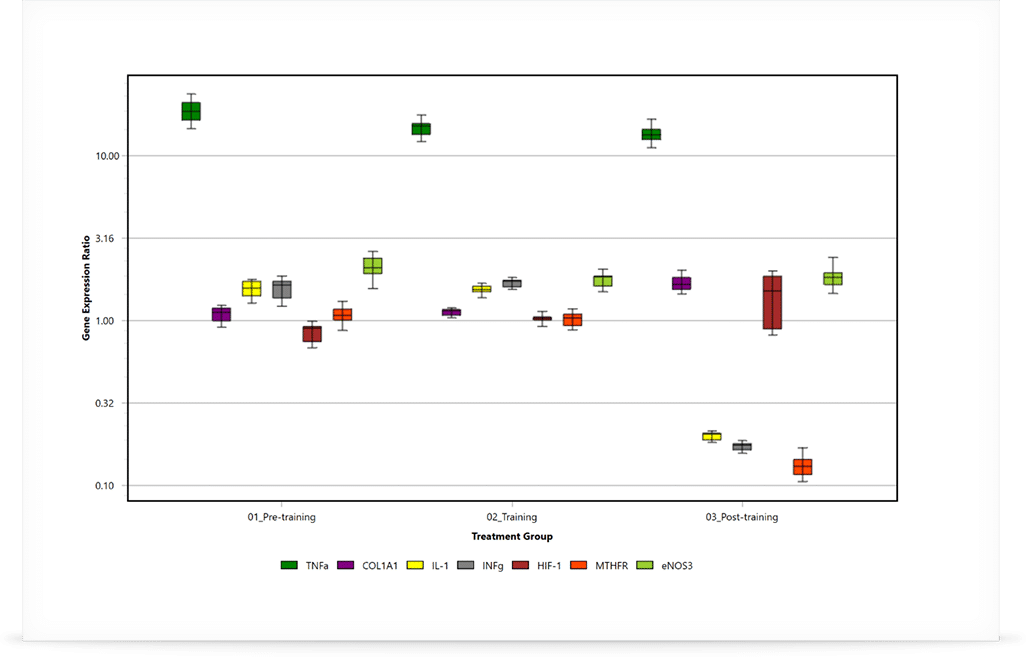
Relative Expression Ratios for example data following REST analysis. Data is graphed as box and whisker plots, with the box representing the inter-quartile and the whiskers being the outer-quartile. The median is shown as the horizontal line in the box.
Analysis of Statistical Data
The final part of the analysis is to determine whether there is statistical meaning to the gene expression ratio between the groups analysed. A robust method of doing this is the Relative Expression Software Tool (REST), first published by Michael Paffl et al. in 2002 and later improved in 2009. This method is considered to have strong statistical foundations as it assumes that the expression ratios are not normally distributed. Most data sets are not normally distributed.
REST analysis utilises non-parametric bootstrapping techniques to calculate the appropriate errors and probability (P) value for the comparison between groups. The distribution of the randomly generated observations is used to determine significance. If the mean calculated gene expression ratio falls outside of more than 95% of the observations, then it can’t be random and it is considered statistically significant (P ≤ 0.05).
In the case that the data has been shown to be normally distributed, an alternative method using a student t-test can be also used. This method is typically applied when using the ΔΔCt method, however care must be taken to confirm the data distribution first. REST will work for all data sets. To the right, you can see two examples generated using Mic’s qPCR software.
Multi-experiment Analysis
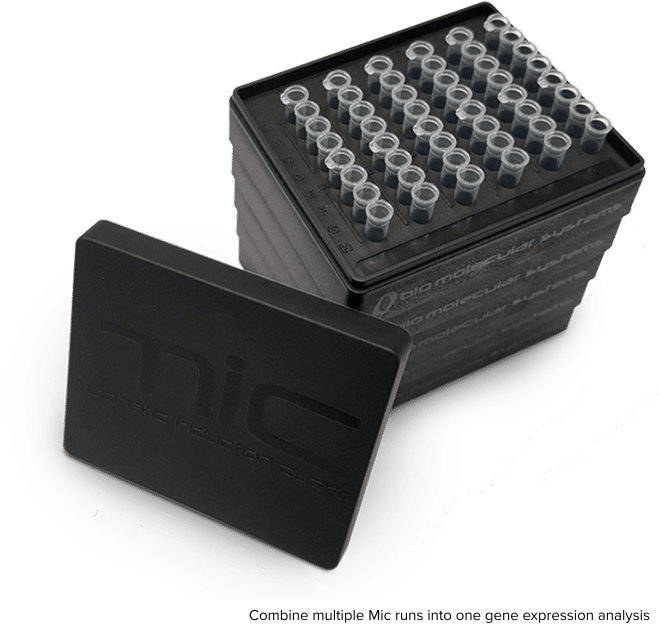
It is now very common to analyse multiple experiments in one analysis. This is easily achievable by connecting up to 10 Mic qPCR cyclers, with data available and collated in real time.
There are a number of methods in use for normalising data sets across multiple experiments:
01
Normalisation between experiments: In this method, a single “control” condition is defined to serve as a correction factor. All measured values in the session are divided by this control value. Though the normalisation method removes variation between sessions, it can lead to increased variation due to the control having a margin of error.
02
Standardisation: Standardisation aims to transform each value in the session into a standard value by subtracting the session mean and dividing the result by the session standard deviation. Standardisation can be used to remove between-session variation. However, it can also lead to increased variability and data bias if the data set is incomplete.
03
Factor Correction: Factor correction aims to address the shortcomings of the normalisation and standardisation methods, by using unbiased measures within an experiment to ensure a smaller residual error. This may be through the “ratio” or the “maximum likelihood” approach. All conditions retain their statistical variance with factor correction.
Based on the published method of Jan Ruijter et al. in 2006, Factor-qPCR can be applied to all of the data sets to ensure the most accurate comparison between experiments. This correction allows for the detection of smaller differences between the control and treatment groups, without the need for an internal reference calibrator.
The Mic PCR Software uses all of the updated data analysis options mentioned above.
Calculate reference gene validation*, Cq, efficiency, gene expression ratios and statistics for multiple experiments. Gene expression analysis with mic’s qPCR Software can be achieved in 3 easy steps.


Assay setup lets you configure your gene target information. You can easily navigate between assay information such as primer sequences; the assay run profile (cycling conditions), or analysis parameters such as indicating the gene function (gene of interest or reference gene). All of this information is stored in an Assay library located anywhere on your PC or network.
Setup your target assays


The easy to use table format for sample editing ensures you don’t miss a thing during sample annotation. Allocate groups and assays to samples at the click of a button. Use copy and paste or import samples to make editing quick and painless. Edit multiple runs at the same time when using Projects.
Setup your samples and groups


It’s all there within view. Find the genes and groups you want and select them at the simple click of a button. Change colours and methods on the go.
Select your genes and groups to analyse along with your preferred method of analysis.
Clear and Concise Results
The results are graphically displayed with various options available such as plotting genes or groups, linear or log scale, and colour selection. Each graph can easily be exported at the click of a button. Remove or add groups or targets with ease using the analysis parameters available.
The table of results is simple and informative, with all the statistics shown in one easy-to-read format. Export the data to Microsoft® Excel® or Clipboard® for hassle-free publication.
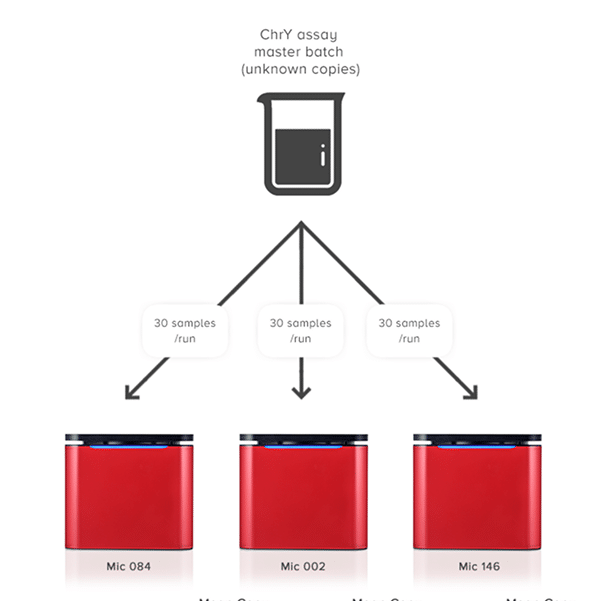
| Mean Copy Copy number %CV | Mean Copy Copy number %CV | Mean Copy Copy number %CV | |
| Experiment 1 | 5.13E+06 2% | 5.29E+06 3% | 5.10E+06 3% |
| Experiment 1 | 5.10E+06 2% | 5.21E+06 2% | 4.96E+06 3% |
| Experiment 3 | 4.96E+06 3% | 5.06E+06 2% | 4.89E+06 3% |
| Combined Runs | 5.06E+06 3% | 5.19E+06 3% | 4.98E+06 3% |
| Overall | 5.08E+06 3% |
Projects
Multi-Run Analysis
Easily analyse multiple experiments in a single Project. Expect assured results due to Mic’s amazing reproducibility between runs and instruments (CV < 5%). This type of reproducibility is within the range of the expected Poisson distribution, especially for low copy numbers that can be as high as 6%. For some block-based cyclers you can expect upwards of 10%.
Combine over 400 samples in one analysis without the need to batch into a 384 well plate.
Learn more about the Mic qPCR
The Mic qPCR instrument uses world-first magnetic induction technology to streamline your results and analysis with impressive accuracy. Mic’s software integrates seamlessly with the Myra liquid handling system and up to nine additional Mics for efficient qPCR data analysis in real time. An internal Temperature Verification System verifies and assures Mic’s unsurpassed temperature uniformity. Mic is also a registered medical device, with CE-IVD and TGA approval. If you’re looking to conduct gene expression analysis via qPCR, Mic offers unmatched flexibility, speed, accuracy and even portability. Get in touch today to arrange a free demo in your own lab.
Ready to streamline your lab workflow?
Power your lab with automation that accelerates testing, reduces errors, and delivers consistent results.