Compatible with other Cyclers
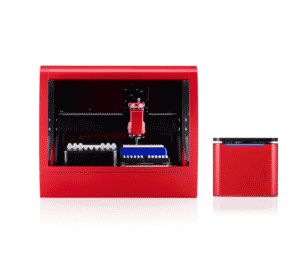
Whether you’re using 48, 96, 384, rotary or uniquely shaped consumables, Bio Molecular System’s Liquid Handler, Myra, can handle them all with precision and accuracy for all your qPCR needs. Load 384-well plates in under an hour, ensuring efficiency in your workflow. Our innovative multi-dispense function, paired with tip re-use, allows you to significantly reduce both processing time and consumable usage, making your experiments more cost-effective and environmentally friendly. Myra functions as a reliable liquid handling system that supports PCR machines, ideal for high-throughput real-time PCR workflows.
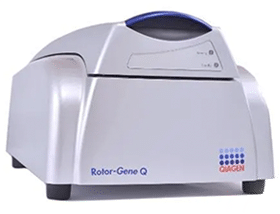
Rotor Gene Q
Qiagen
Save the reaction plate layout in SMP format to generate a file that can be imported into the Rotor-Gene software. This includes some options for arranging samples into pages. This option is available when the selected Reaction Plate is a Rotor-Gene Rotor-Disc or tube strips.
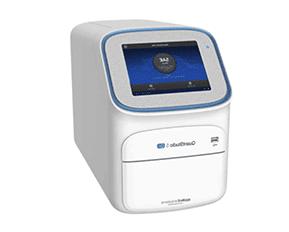
QuantStudio
Thermo Fisher Scientific
Save the reaction plate layout in QuantStudio format to generate a plate import file that is compatible with QuantStudio software v1.5 or v2.6. This includes sample type, target information and standard concentrations.
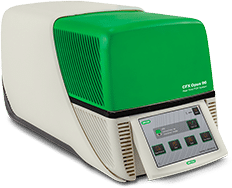
CFX
Bio-Rad
Save the reaction plate layout in CFX format to generate either a file that is compatible with the spreadsheet import function of the CFX Maestro plate editor or a CFX LIMS import file that will contain additional information such as sample type, target information and standard concentrations.
Seamless Integration
Experience a perfectly seamless workflow when connecting the Myra liquid handling robot used for PCR, with the Mic cycler for qPCR. Both instruments can be operated from a single user interface, eliminating the need for exporting or importing sample names. Simply set up, run, and analyze your experiments all in one convenient location. Once done, you can configure experiments for multiple Mic cyclers using a single Myra liquid handling system and analyze the results in a unified file using the Project feature.
Myra’s seamless integration with other leading cyclers means you can export reaction lists directly to devices like the Bio-Rad CFX, Thermo QuantStudio, or Qiagen Rotor-Gene with just a few clicks. This streamlined process ensures accuracy and consistency across all your qPCR runs, letting you focus more on your research and less on manual tasks.
qPCR on Myra
Browse a comprehensive table of all available templates on Myra, complete with direct links to specific MyraScript pages. Access protocol documentation via a dedicated PDF link. Verified options include templates for BMS, Partner (kit company), and the Myra community (customers).
| Kit | Verified By |
|---|---|

| BMSCommunity |
Case Study: Gene Expression Studies using Myra and Mic
The experiment outlined in BMS Workbench Application Note 9 was designed to investigate the effects of different anabolic steroids on the expression levels of specific genes in a biological system. Specifically, the study aimed to quantify how the administration of three different drugs-oxymetholone, testosterone, and nandrolone-affects the expression of three target genes: ACE, ACTN3, and Calcineurin. These genes were selected based on their potential roles in response to steroid treatment.
The experiment utilized Relative Quantification, a qCR technique, to measure the relative expression levels of the target genes compared to two housekeeping genes, B2M and GAPDH, which serve as internal controls. By comparing the gene expression levels in the presence of the drugs to those in a control group, the experiment sought to determine whether these steroids increase, decrease, or have no effect on the expression of the selected genes.
The results provide insight into the molecular mechanisms by which these drugs influence gene activity, which could have implications for understanding their broader biological effects.
Experimentation
Myra and Mic combination.
The key steps in the workflow for conducting the gene expression study using Myra and Mic systems are crucial for ensuring accurate and reproducible results. The process begins with defining and configuring the necessary assays, which include selecting the appropriate genes, primers, and reaction components.
Next, the Myra system is set up to prepare and distribute the reactions, with careful attention to deck layout and sample grouping. The experiment then progresses through running the Myra and transferring samples to the Mic rotor for thermal cycling. The data collected is combined and analyzed using a qPCR Project file, which allows for comparative analysis across multiple runs. Finally, Relative Quantification analysis is performed to determine the impact of the drug treatments on gene expression, with results visualized and interpreted through statistical analysis. Each step is designed to ensure precision and reliability in measuring gene expression changes.
Step 1
Define the Assays
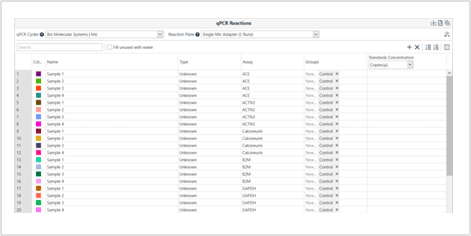
Assays must be defined and configured with consistent chemistry, run profiles, and reaction setups across all samples. For the example workflow, assays were created for three target genes (ACE, ACTN3, Calcineurin) and two housekeeping genes (B2M, GAPDH). Proper assay configuration ensures that Myra can use the same tube for all reactions, with all components and primers correctly specified.
Step 4:
Transfer Tubes To Rotor
After the Myra run, tubes are capped and placed in the Mic rotor, ensuring thermal uniformity by filling unused positions with water.
Step 6:
Create a qPCR Project
Multiple runs are combined in a qPCR Project file for analysis, eliminating bias through consistent thresholding and fluorescence correction.
Step 2:
Setup Myra
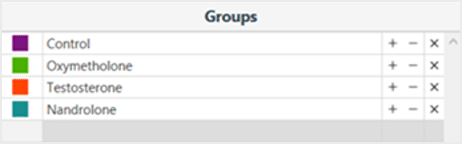
The setup involves creating a reaction-driven qPCR run file, defining biological replicates, and configuring the deck layout. The example provided uses 16 samples across four groups (control and three drug treatments) with sufficient biological replicates to ensure statistical significance.
Step 3:
Run the Myra
Once setup is complete, Myra is connected to the PC, and the run is initiated. If new components are used, calibration may be necessary.
Step 5:
Start the Mic Run
The Mic run is initiated using the qPCR setup file, with data collected across multiple runs if needed.
Step 7:
Perform Relative Quantifcation Analysis
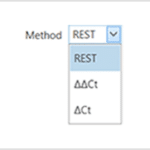
Perform Relative Quantification Analysis The analysis involves assigning roles to genes (e.g., Gene of Interest, Reference Gene) and treatment groups, using the REST method for non-parametric error calculation. Results are visualized through box-and-whisker plots and summarized in tables, highlighting statistically significant changes in gene expression.
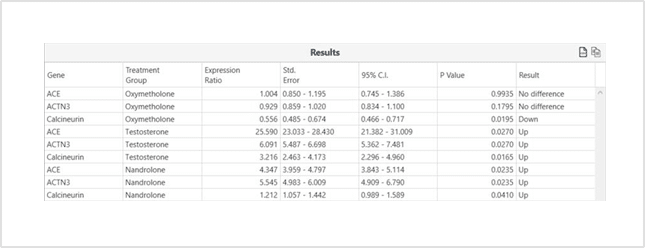
Results
Analysis beyond just simple Cq value.
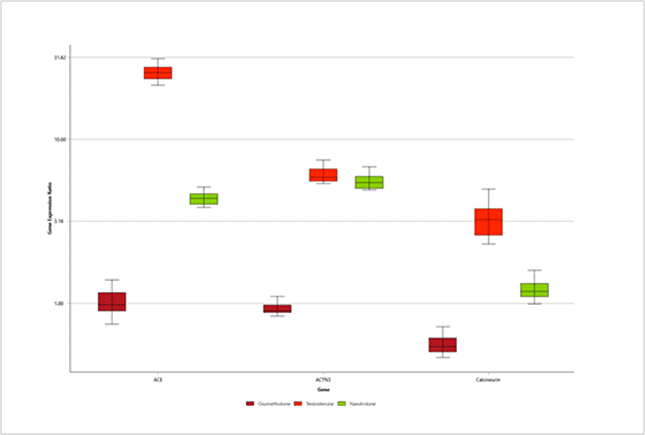
The results interpretation from the experiment reveals how anabolic steroids influence gene expression. Testosterone and nandrolone significantly increased the expression of all three target genes (ACE, ACTN3, Calcineurin), with testosterone showing a more than 25-fold increase in ACE expression. In contrast, oxymetholone selectively reduced the expression of Calcineurin by half but did not affect ACE or ACTN3. These changes suggest that testosterone and nandrolone broadly activate gene expression, potentially enhancing muscle-related pathways, while oxymetholone might selectively suppress certain cellular functions. The results were statistically validated, confirming the significance of these findings.
Additional Accessories
The following accessories are suggested blocks that can be used to achieve qPCR setup on the Myra liquid handling system.
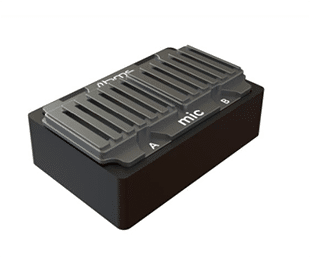
Myra 2x Mic Racks Cooling Block
MYRA-COOLMIC
Designed to provide passive cooling for 2 x 48 well Mic Racks.
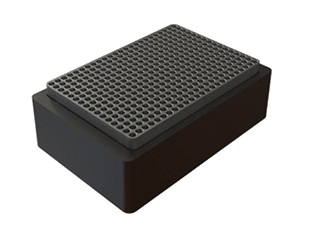
Myra 384 Well Cooling Block
MYRA-COOL384
Designed to provide passive cooling for 384 tapered well plates.
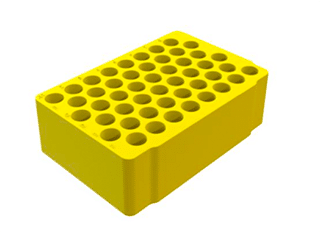
Myra 48x Screw Cap Microcentrifuge Tube Loading Block
MYRA-LB48
Designed to hold up to 48x 1.5/2.0 mL screw cap tubes (tapered or flat bottom). 3D printed from PLA plastic.
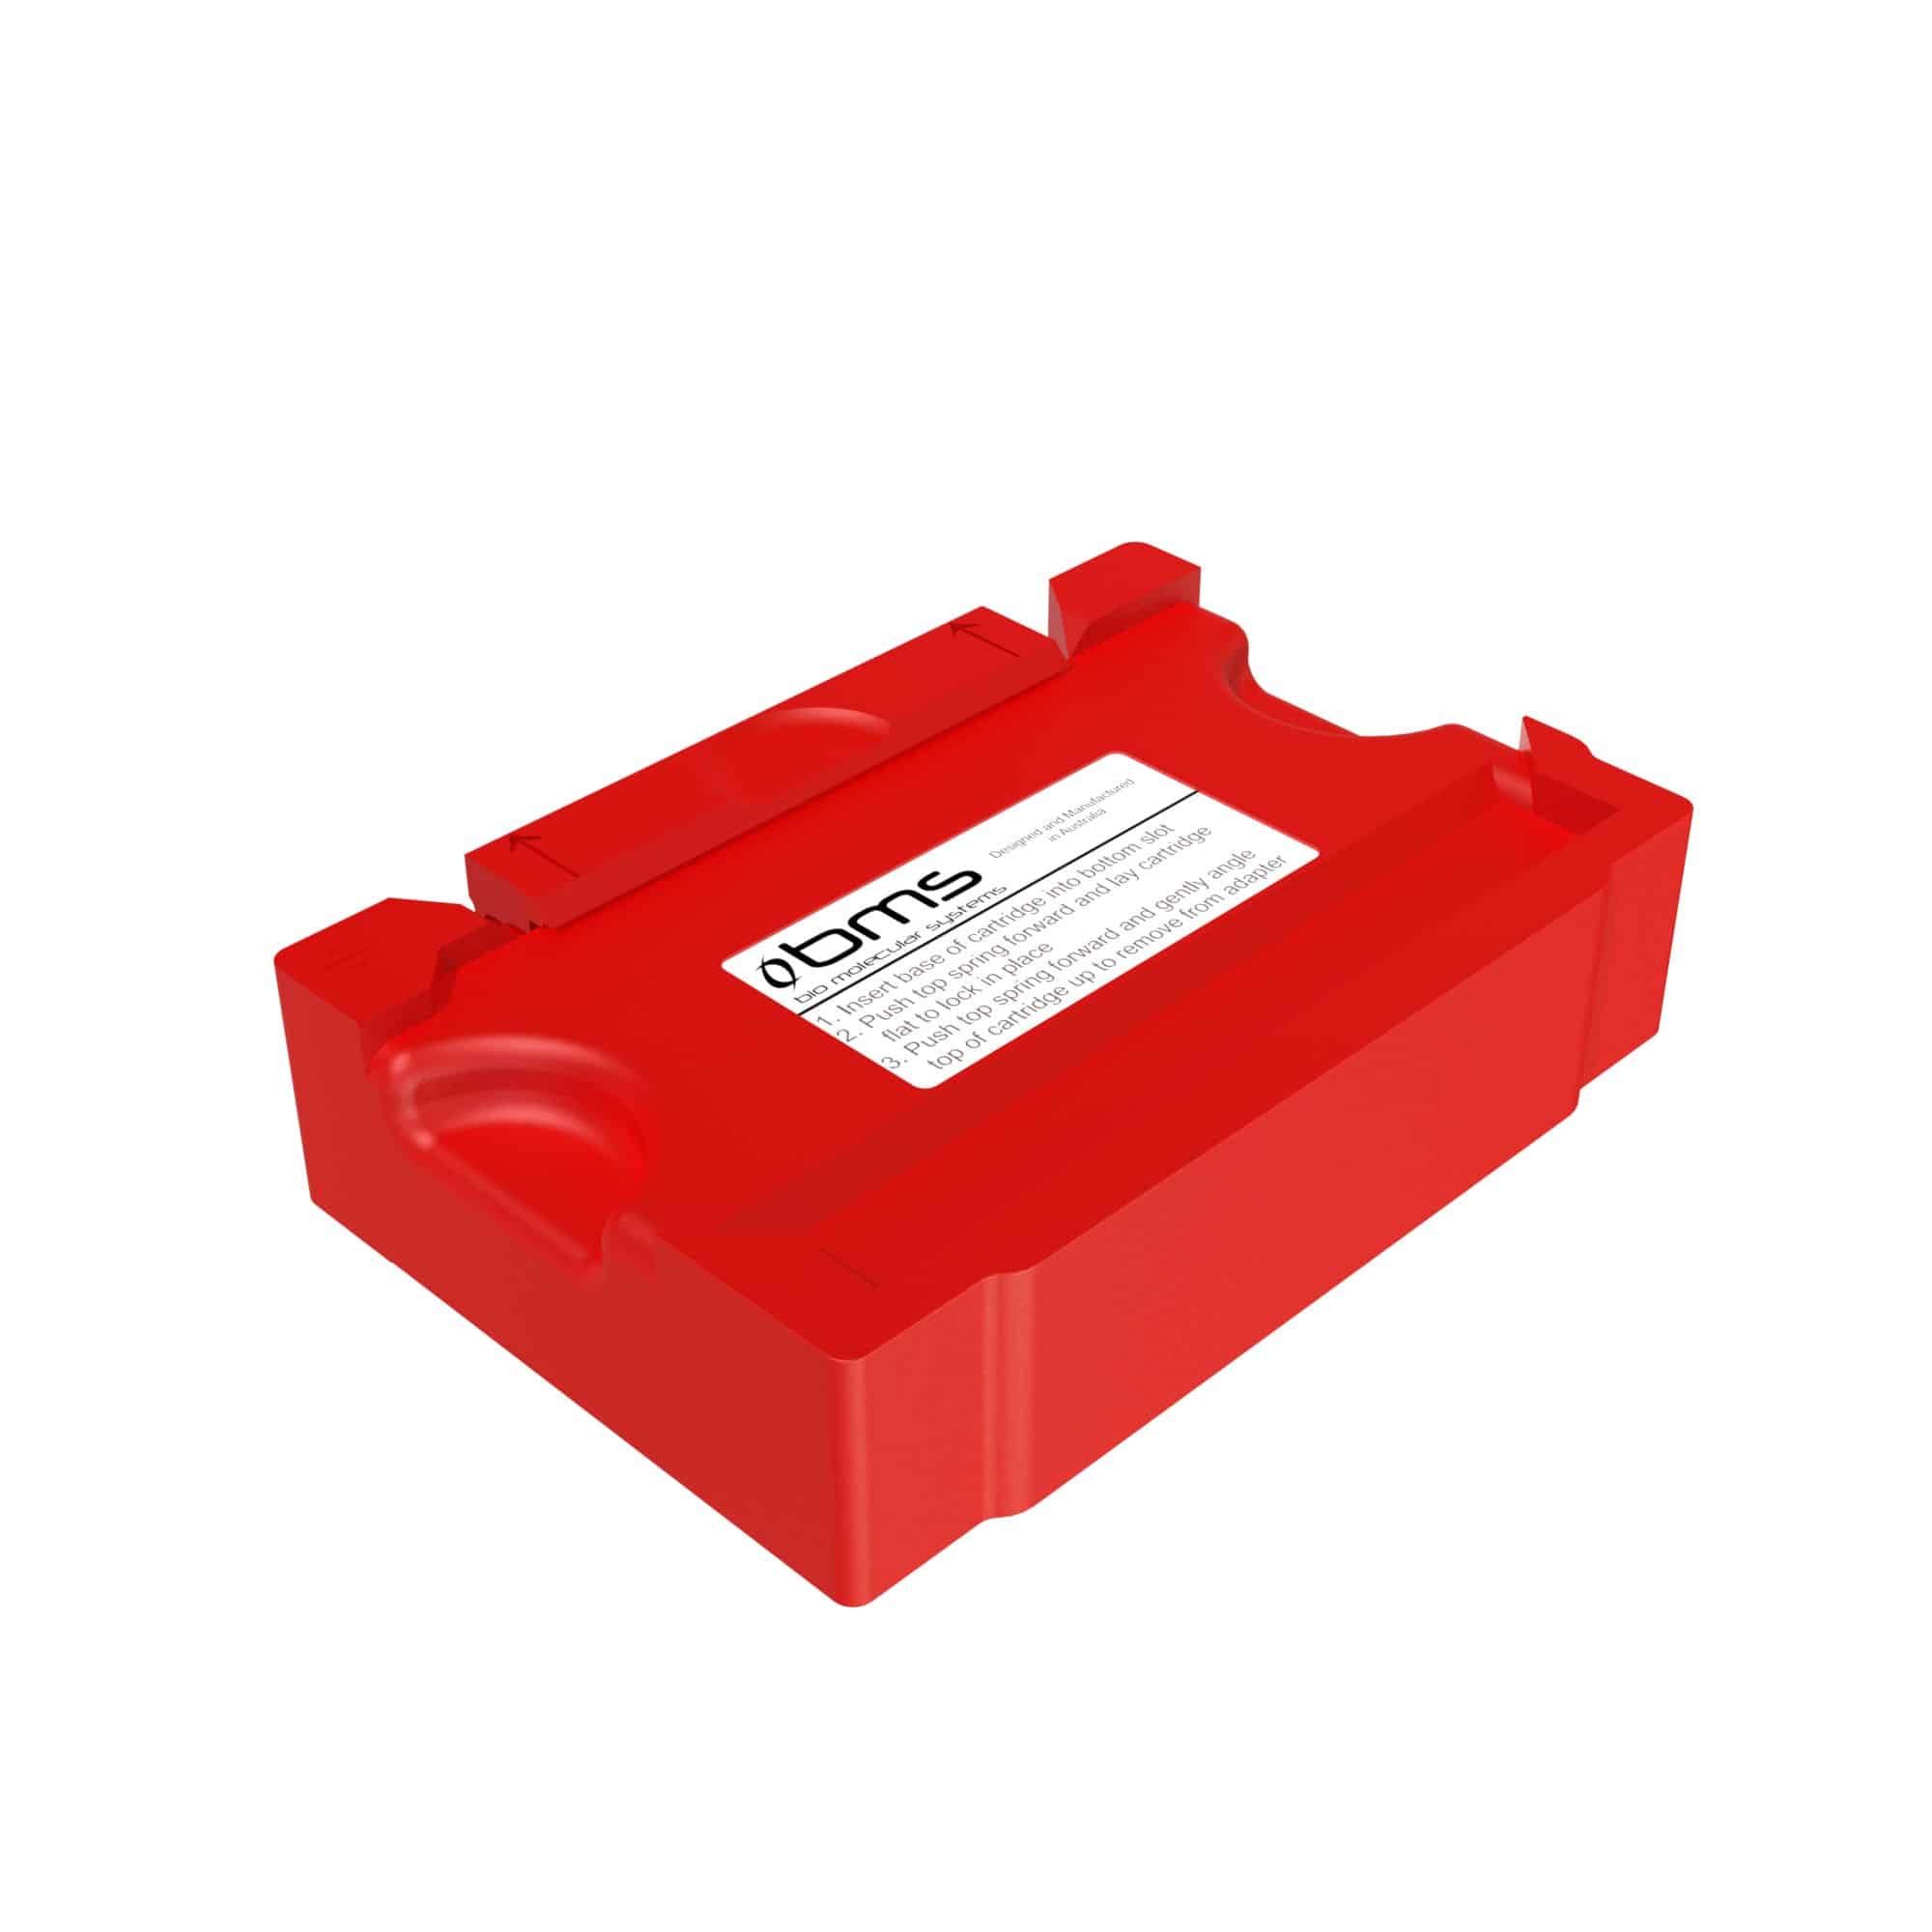
Myra BD Max PCR Cartridge Adapter
MYRA-LB-BDMAX
Designed to hold the BD Max PCR cartridges used with the BD MAX Molecular Diagnostic Testing System.
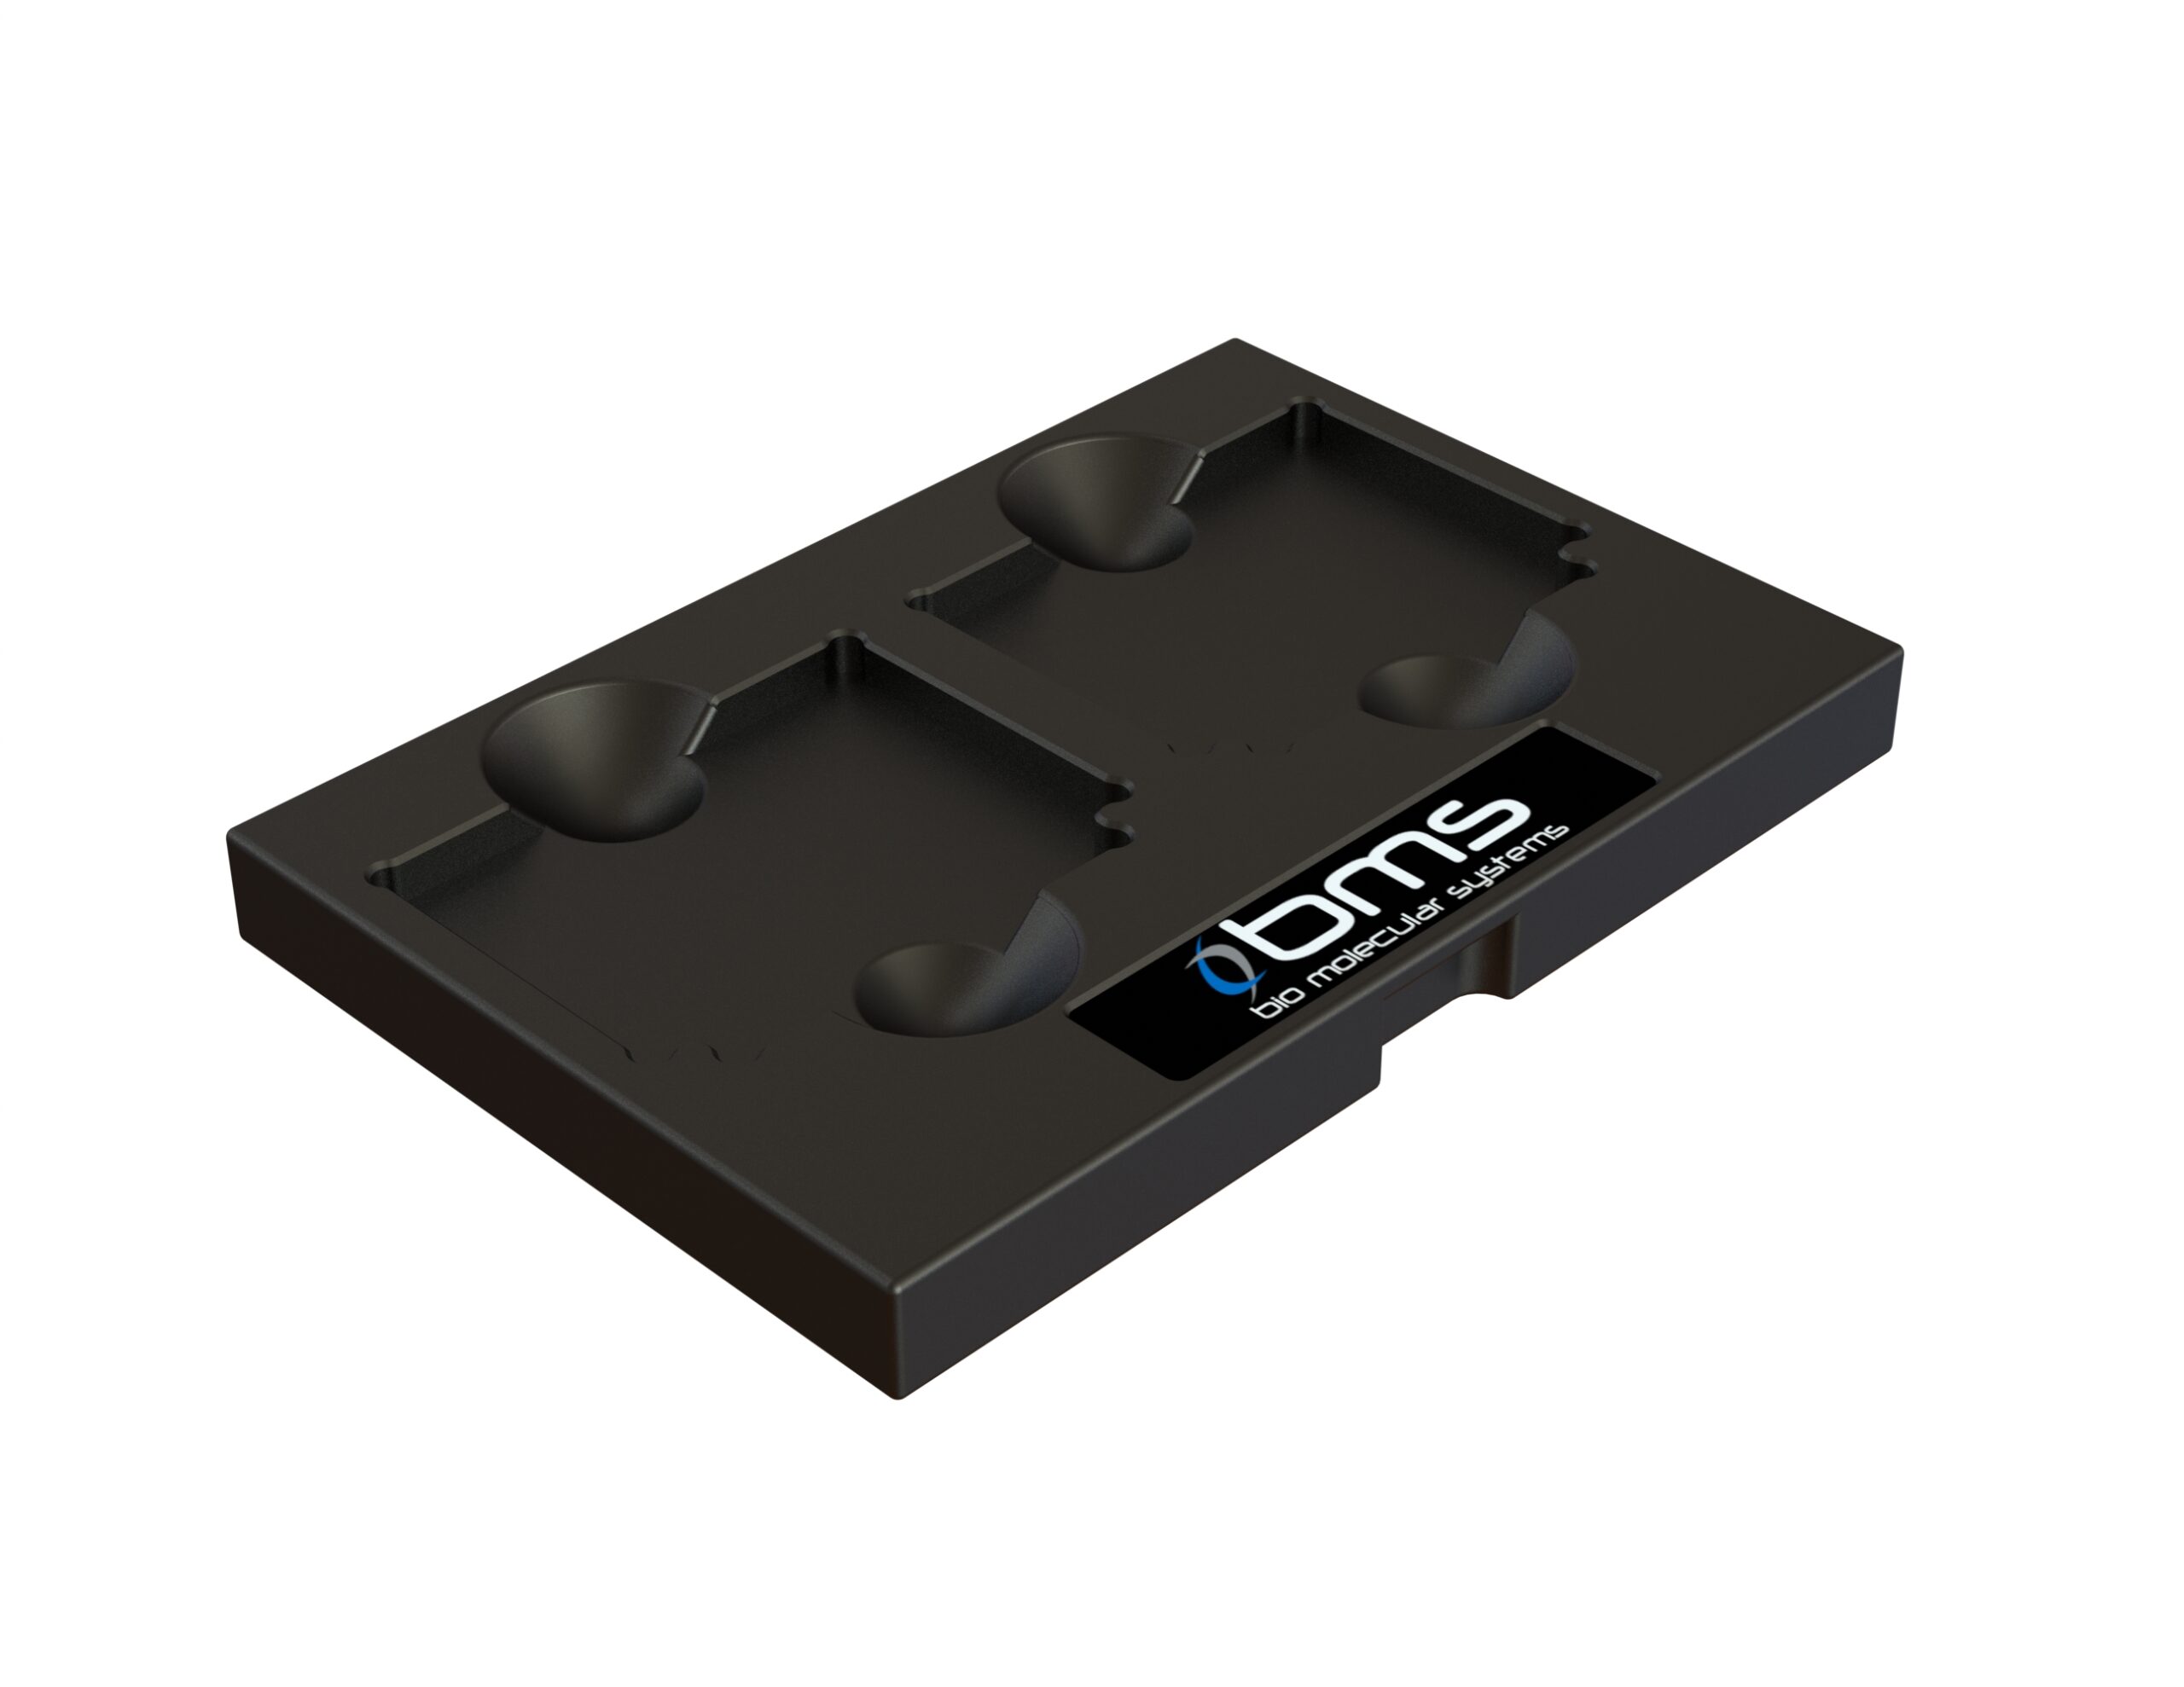
Myra 2x Mic Racks Adapter
MYRA-LBMIC
Designed to hold 2 x 48 well Mic Racks. Made from aluminium.
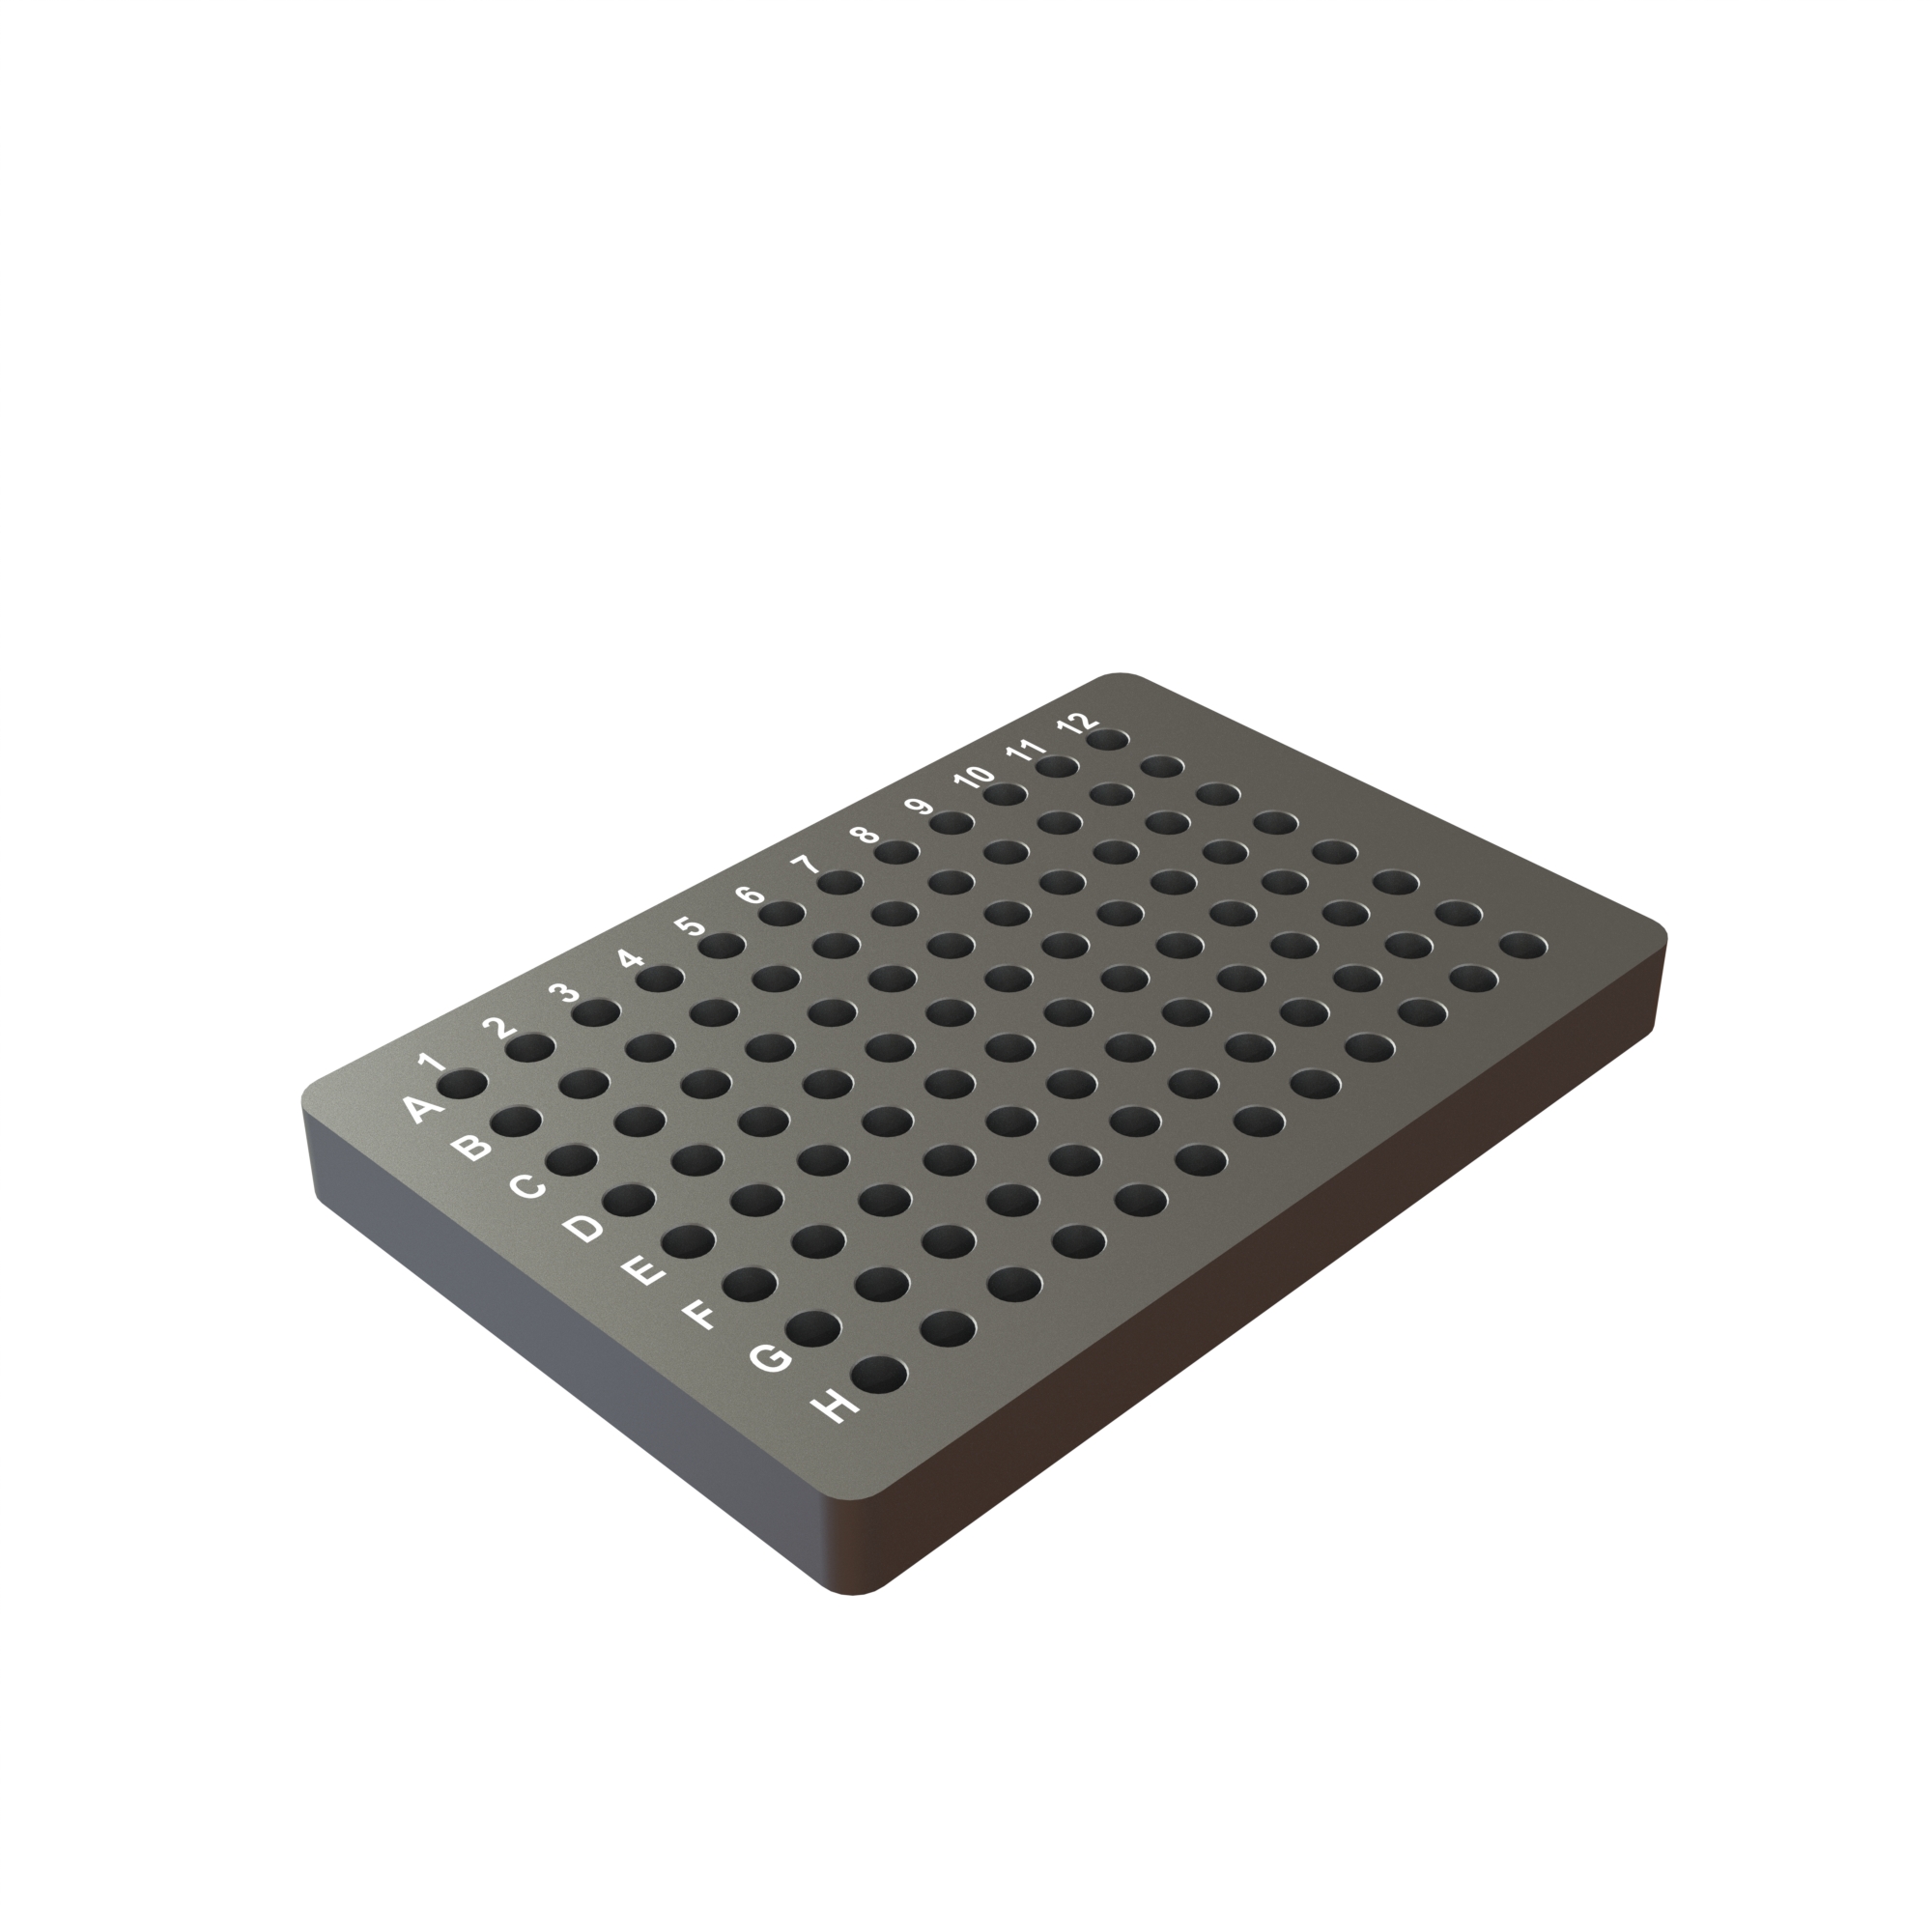
Myra 96x 0.2 mL Tube/Plate Loading Block
MYRA-LB96
Designed to hold up to 96 x 0.2 mL tubes including strips of 8, and 96 well unskirted and semi-skirted plates (low and high profile). Made from aluminium.
Frequently Asked Questions
What is real-time PCR and how does it work?
Real-time PCR, or qPCR, is a lab method used to detect and measure DNA or RNA that has first been converted into DNA during each cycle of amplification. As the reaction runs, fluorescent dyes or probes bind to the genetic material. The equipment tracks the increase in signal, showing how much DNA is produced in real time. This approach is useful in many areas, from studying gene expression to detecting pathogens or identifying genetic mutations. Researchers value real-time PCR because it is speedy, precise, and can quantify targets in a single process.
What are the advantages of using Myra within Real-Time PCR systems?
Myra, as an automated liquid handling system for PCR machines, improves real-time PCR workflows by automating the liquid handling steps that are often done manually. This reduces the risk of pipetting errors, which can affect the accuracy of results. Myra delivers consistent sample preparation across all wells, helping ensure reproducibility from run to run. It also saves time and reduces hands-on workload, making it ideal for high-throughput labs or anyone wanting greater confidence in their PCR data.
In What Settings Can Real-Time PCR with Myra Be Used?
Myra can facilitate real-time PCR workflows in applied research laboratories, diagnostic centers, pharmaceutical research and agriculture testing. Myra guarantees flexibility and precision in different qPCR applications.
Additionally, Myra’s use in real-time PCR machines goes beyond standard research labs, diagnostics and agriculture. It also plays a role in areas like environmental monitoring, where it can support water and soil testing for pathogens. In food safety, Myra helps with detecting contamination and verifying GMO status. Veterinary labs use it for animal health diagnostics, and it’s useful in biotech manufacturing for quality control of biologics. Some labs even rely on Myra for forensic DNA analysis or to set up multiplex assays for gene editing studies.
Where Can I Learn More?
Ready to see Myra in action? Request a demo model or contact us with any questions about how Myra can support your PCR workflows.